
1. Competitive forces, Competitive Profile Matrix (CPM), and competitors ratios Deliverables for this
a. Competitive forces analysis
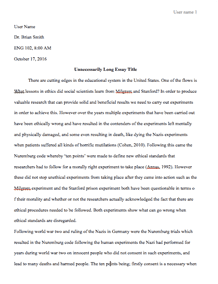
Competitive forces model identifies and analyzes the five forces that shape every industry and helps in the determination of an organizations strengths and weaknesses. The forces are; power of suppliers, power of customers, competition in the industry, and threat of substitute products and potential of new entrants into the industry (McWilliams, 2004). With respect to Best Buy Inc., its competitive forces are as follows;
Bargaining power of suppliers: there is a low concentration of suppliers meaning that there are many suppliers with limited bargaining powers which positively affects Best Buy Inc. furthermore, volume is critical to suppliers that is when suppliers are dependent on high volumes and thus have less bargaining power since a producer can threaten to cut volumes thus hurting the suppliers profits (Grundy, 2006).
Bargaining power of customers: since customers at Best Buy Inc. do not make huge purchases they do not have bargaining power. It thrives to retain customers by offering low prices and quality products
Barriers to entry and exit: in the market where Best Buyer corporation operation, the market entry and exit are rigid due to the huge investments required thus not easy to liquidity such huge business.
Threat of substitutes: Best Buys threat of substitute is low; there are few vendors such as Wal-Mart.
Industry rivalry: its rivals include: Wal-Mart, radio shack and Circuit city, however, it still excels and exceeds its rivals since it offers quality service and variety.
b. CPM analysis
Competitive Profile Matrix with other corporations
Best Buy Wal-Mart Target Dell
Critical Success Factors Weight Rating Weighted Score Rating Weighted Score Rating Weighted Score Rating Weighted Score
Customer Service 0.1 3 0.3 1 0.1 3 0.3 3 0.3
Sales Knowledge 0.1 3 0.3 1 0.1 2 0.2 1 0.1
Advertising 0.2 4 0.8 4 0.8 3 0.6 2 0.4
Price 0.15 2 0.3 4 0.6 3 0.45 3 0.45
Product Quality 0.1 3 0.3 2 0.2 2 0.2 4 0.4
Market Share 0.1 4 0.4 3 0.3 2 0.2 3 0.3
Financial Position 0.15 3 0.45 4 0.6 3 0.45 3 0.45
Expansion Plans 0.1 2 0.2 4 0.4 2 0.2 1 0.1
Total 1 3.05 3.1 2.6 2.5
Source: Reuters.com
Current and historical Financial Statements
Income Statement (I/S)
Annual Income Statement (values in 000's) Get Quarterly DataPeriod Ending: Trend 1/28/2017 1/30/2016 1/31/2015 2/1/2014
Total Revenue $39,403,000 $39,528,000 $40,339,000 $40,611,000
Cost of Revenue $29,963,000 $30,337,000 $31,292,000 $31,212,000
Gross Profit $9,440,000 $9,191,000 $9,047,000 $9,399,000
Operating Expenses
Research and Development $0 $0 $0 $0
Sales, General and Admin. $7,547,000 $7,618,000 $7,592,000 $8,106,000
Non-Recurring Items $39,000 $198,000 $5,000 $149,000
Other Operating Items $0 $0 $0 $0
Operating Income $1,854,000 $1,375,000 $1,450,000 $1,144,000
Adel income/expense items $34,000 $15,000 $27,000 $39,000
Earnings Before Interest and Tax $1,888,000 $1,390,000 $1,477,000 $1,183,000
Interest Expense $72,000 $80,000 $90,000 $100,000
Earnings Before Tax $1,816,000 $1,310,000 $1,387,000 $1,083,000
Income Tax $609,000 $503,000 $141,000 $388,000
Minority Interest $0 $0 ($2,000) $9,000
Equity Earnings/Loss Unconsolidated Subsidiary $0 $0 $0 $0
Net Income-Cont. Operations $1,207,000 $807,000 $1,246,000 $695,000
Net Income $1,228,000 $897,000 $1,233,000 $532,000
Net Income Applicable to Common Shareholders $1,228,000 $897,000 $1,233,000 $532,000
Source (http://www.nasdaq.com/symbol/bby/financials?query=income-statement#ixzz4jNih513Z)
Balance Sheet (B/S)
Annual Income Statement (values in 000's) Get Quarterly DataPeriod Ending: Trend 1/28/2017 1/30/2016 1/31/2015 2/1/2014
Current Assets
Cash and Cash Equivalents $2,240,000 $1,976,000 $2,432,000 $2,678,000
Short-Term Investments $1,681,000 $1,305,000 $1,456,000 $223,000
Net Receivables $1,347,000 $1,162,000 $1,280,000 $1,308,000
Inventory $4,864,000 $5,051,000 $5,174,000 $5,376,000
Other Current Assets $384,000 $392,000 $1,130,000 $900,000
Total Current Assets $10,516,000 $9,886,000 $11,472,000 $10,485,000
Long-Term Assets
Long-Term Investments $0 $0 $0 $0
Fixed Assets $2,293,000 $2,377,000 $2,462,000 $2,598,000
Goodwill $425,000 $425,000 $425,000 $425,000
Intangible Assets $0 $0 $57,000 $101,000
Other Assets $622,000 $831,000 $829,000 $404,000
Deferred Asset Charges $0 $0 $0 $0
Total Assets $13,856,000 $13,519,000 $15,245,000 $14,013,000
Current Liabilities
Accounts Payable $6,233,000 $5,764,000 $6,414,000 $6,586,000
Short-Term Debt / Current Portion of Long-Term Debt $44,000 $395,000 $41,000 $45,000
Other Current Liabilities $845,000 $766,000 $1,322,000 $805,000
Total Current Liabilities $7,122,000 $6,925,000 $7,777,000 $7,436,000
Long-Term Debt $1,321,000 $1,339,000 $1,572,000 $1,612,000
Other Liabilities $704,000 $877,000 $896,000 $976,000
Deferred Liability Charges $0 $0 $0 $0
Misc. Stocks $0 $0 $0 $0
Minority Interest $0 $0 $5,000 $3,000
Total Liabilities $9,147,000 $9,141,000 $10,250,000 $10,027,000
Stock Holders Equity
Common Stocks $31,000 $32,000 $35,000 $35,000
Capital Surplus $0 $0 $437,000 $300,000
Retained Earnings $4,399,000 $4,130,000 $4,141,000 $3,159,000
Treasury Stock $0 $0 $0 $0
Other Equity $279,000 $216,000 $382,000 $492,000
Total Equity $4,709,000 $4,378,000 $4,995,000 $3,986,000
Total Liabilities & Equity $13,856,000 $13,519,000 $15,245,000 $14,013,000
Source (http://www.nasdaq.com/symbol/bby/financials?query=balance-sheet#ixzz4jNj0XTWp)
Statement of Cash Flows
Annual Income Statement (values in 000's) Get Quarterly DataPeriod Ending: Trend 1/28/2017 1/30/2016 1/31/2015 2/1/2014
Net Income $1,228,000 $897,000 $1,233,000 $532,000
Cash Flows-Operating Activities
Depreciation $654,000 $657,000 $656,000 $716,000
Net Income Adjustments $317,000 $293,000 ($180,000) $526,000
Changes in Operating Activities
Accounts Receivable ($185,000) $123,000 ($19,000) $7,000
Changes in Inventories $193,000 $86,000 ($141,000) $597,000
Other Operating Activities $10,000 $36,000 $29,000 ($70,000)
Liabilities $328,000 ($770,000) $355,000 ($1,205,000)
Net Cash Flow-Operating $2,545,000 $1,322,000 $1,935,000 $1,094,000
Cash Flows-Investing Activities
Capital Expenditures ($582,000) ($649,000) ($561,000) ($547,000)
Investments ($356,000) $146,000 ($1,224,000) ($180,000)
Other Investing Activities $51,000 $84,000 $73,000 $210,000
Net Cash Flows-Investing ($887,000) ($419,000) ($1,712,000) ($517,000)
Cash Flows-Financing Activities
Sale and Purchase of Stock ($527,000) ($1,008,000) $50,000 $171,000
Net Borrowings ($394,000) ($28,000) ($24,000) $381,000
Other Financing Activities $22,000 $20,000 $2,000 $0
Net Cash Flows-Financing ($1,404,000) ($1,515,000) ($223,000) $319,000
Effect of Exchange Rate $10,000 ($38,000) ($52,000) ($44,000)
Net Cash Flow $264,000 ($650,000) ($52,000) $852,000
Source (http://www.nasdaq.com/symbol/bby/financials?query=cash-flow#ixzz4jNjc5tt2)
3. Financial ratios from the most current and available 3 years with deltas and analysis
Profitability ratios
Source: Reuters.com
Leverage Ratios
Source: Reuters.com and Best Buy.com
Source: Reuters.com
4. Alternative strategies (giving advantages and alternatives for each)
The alternative strategies that I can recommend to the company are to have a more financial capital to expand B2B centers throughout every Best Buy stores. It can also have single point of contact for small ventures to embrace technology solutions which can foster the business.
References
Grundy, T. (2006). Rethinking and reinventing Michael Porter's five forces model. Strategic Change, 15(5), 213-229.
McWilliams, G. (2004). Analyzing customers, Best Buy decides not all are welcome. The Wall Street Journal Online.
Request Removal
If you are the original author of this essay and no longer wish to have it published on the customtermpaperwriting.org website, please click below to request its removal:

