
Trade flow is whereby countries sell and buy goods and service amongst themselves. Also, trade flow is the measure of trade of balance. In this case trade of balance is the difference between exports and imports that is the total goods that one country sells to other countries minus the total goods that a country buys from other countries (Long, 2017). Seemingly, there are two types of trade flows, net importers, and net exporters. Net exporters are countries that export more to the international clients than the import from international producers. Net exporters countries usually run a trade surplus since they sell more goods to the international market than they buy. Therefore, the demand for currency for that country multiplies since international clients have to buy the countrys currency for them to purchase their goods. Hence leading making the currency of the country to rise (Investopedia, 2017). On the other hand, net importers are countries import more from the international producers than the sell to the international clients. Therefore, most countries that are net importers run on trade deficit since the buy more foreign goods than they sell to the international market. Moreover, to buy these goods, they have to sell their domestic currency and buy foreign currency which leads to their domestic currency to fall.
Between 1870 and 1900, there was an increase in world trade due to the industrial revolution. The industrial revolution led to the expansion of trade, technology, and capital as well as resulted in the explosion of communications and migration (World Trade Organization, 2013). Particularly, the advancements in transport technology led to the opening up of national economies to trade in ways that differed from what had been happening before. In turn, this resulted in the world merchandise trade in the period to be a little bit higher than the GDP. In the next few years, between 1900 and 1913, the growth of world merchandise trade became much higher the rate of growth of world GDP mainly due to a continuing improvement in transportation and improved access to various regions in the world (World Trade Organization, 2013). The growth of world merchandise trade became much lower than the growth in GDP between the years 1913 and 1950 due to the lack of global leadership and cooperation (World Trade Organization, 2013). There was pressure for war reparations as well as loan repayments which undermined the recovery efforts of countries thus poisoning relations resulting in further problems in international cooperation. Countries experienced a lot of challenges in restructuring their industries as well as finding employment for the millions of soldiers who remained unemployed. Between 1950 and 1973, both the rate of growth of international merchandise trade and world GDP increased at a higher rate showing that the world was re-globalizing thus accelerating the integration process that was greatly affected by the political chaos in the previous years (World Trade Organization, 2013). There were postwar commitments and multilateral institutions which allowed for the integration of world economies. Finally, between 1973 and 2007, the rate of growth of world merchandise trade and world GDP decreased but remained stable due to the continuing improvement of transport, technology, and communication (World Trade Organization, 2013).
Application of Net Export to China
According to Economic Complex Index, China is the biggest export economy in the world and the 38th most complex economy (Atlas.media.mit.edu, 2017). The exports of China in 2015, was 2.37 trillion dollars and imports were 1.27 trillion dollar, which results in a balance of trade of 1.1 trillion dollars. In the same year, the Gross Domestic Product (GDP)of China was 11 trillion dollar, and its GDP per capita was 14.5 thousand dollars. China exports a lot of good and services, and its top ten exports account for 67.6 percent roughly two-thirds of the overall value of its global shipments. From the perspective of the continent, by value, 49.8 percent of Chinas exports is delivered to other Asia countries, while 21.2 percent is exported to North America. Whereas, 18.5 percent is shipped to clients in Europe and 4.4 percent shipped to Africa (Johnston, 2017).
As mention earlier China exports several goods and the following are among the top ten goods in the year 2016 (Workman, 2017). Also, besides each good is a share of the percentage that represents the overall exports of China. They include electrical machinery, equipment 26.3 percent, machinery including computers 16.3 percent, furniture, bedding, lighting, signs, prefab building 4.2 percent. Also, knit or crochet clothing 3.5 percent, clothing accessories 3.4 percent, Optical, technical and medical apparatus 3.2 percent, plastic and plastic articles 3 percent. Vehicles contributed 2.9 percent, while iron and steel 2.5 percent and lastly footwear contributed 2.3 percent. The fastest growing good is the plastic and plastic articles followed by furniture, beddings, lighting signs and prefab. The third on the list of fastest growing is the made-in-china vehicles then electrical machinery and equipment. The slowest is the knit or crochet clothing and accessories.
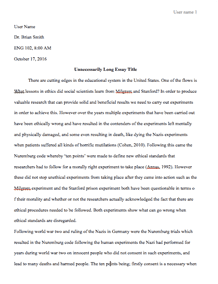
Chinas Five-Year Net Export Figure (2010-2015)
Trade in US dollar
2010 2011 2012 2013 2014 2015
Exports 1.75 T 2.04 T 2.12 T 2.25 T 2.37 T 2.37 T
Imports 1.10 T 1.39 T 1.24 T 1.56 T 1.53 T 1.27 T
Net exports 0.65 T 0.65 T O.88 T 0.69 T 0.84 T 1.10 T
Chinas exports have been increasing steadily from 2010 to 2014. However, the exports have remained constant. From 2010 to 2015 Chinas exports have increased at an annual rate of 5.7 percent, that is, 1.75 trillion dollars in 2010 to 2.37 trillion dollars in 2015. Whereas, the imports vary from one year to another. Nonetheless, Chinas imports increased at an annual rate of 2.3 percent, that is from 1.10 trillion dollars in 2010 to 1.27 trillion dollars in 2015. Finally, Chinas net exports are favorable since in the five years the exports have exceeded the imports. This is beneficial to domestic producers and domestic consumers since the producers will sell their products at a higher price to the international market while consumers will purchase the goods at a lower price from the domestic producers (Amadeo, 2017).
Effects of Chinas Net Exports on the Countrys GDP
The figure above shows the relationship between the net export and gross domestic product of China. From the diagram, the net export of China from 2010 to 2013 varies whereas from 2013 to 2015 the net export increases accumulatively. On the other hand, Chinas GDP from the diagram increases steadily from 2010 to 2015. The net exports of China are positive throughout the five years. Since GDP is the sum of consumer spending, investment by businesses, government spending and net exports, it implies that an increase in net exports increases the GDP of a particular country. Chinas GDP has been increasing steadily from 2010 to 2015, and at the same period, the net export has been positive. However, the net export remained at the same level in 2010 and 2011, yet the GDP increased at this period. This can be attributed to the huge investments by the government in various sectors of the economy. Similarly, the increased government investments contributed greatly to Chinas GDP to allow for it to increase between 2012 and 2013. Nonetheless, the net exports still contributed to China having a high GDP hence allowing for the country to move forward in being an economic powerhouse.
Measures to Sustain a Positive Net Export
Exporting implies a country is selling their goods and services to the international market. Those goods and services bring profit to the country which increases the countrys GDP. On the other hand, when a country imports goods and services it implies it buys goods from the international market. Therefore the countrys GDP decreases since the money leaves the country. Additionally, net exports can either be positive or negative (Infoplease.com, 2017). Positive net exports occur when imports are lower than the exports whereas negative net exports occur when exports are lower than the imports. Besides, net exports can be zero, where exports and imports are equal to each other. Nonetheless, if a country has a positive net export, it means the nation has a positive trade balance at the same time if a country has negative net exports it means the nation has a negative trade balance. Apparently, every country wants its economy to be better and bigger. Hence no country wants a negative trade balance. Due to this reason countries try to protect their markets by use of a policy called trade protectionism (Economicsonline.co.uk, 2017). The implementation of protectionism policies can be in four ways; use of taxation with tariffs, import quotas, product standards and governmental subsidies.
There exists three types of tariffs, scientific tariffs, peril point tariffs, and retaliatory tariffs that can be used for protective measures in maintaining a positive net export(Adobe Spark, 2017). Moreover, the government collects and charges all forms of tariffs for the purpose of raising the price of imports to be equivalent or top their local prices. The imposition of scientific tariffs is mainly to end the use of a product by raising the prices of the product. Peril point tariffs are imposed when industries that are less efficient are at the risk of closure because of their inability to compete with pricing. On the other hand, retaliatory tariffs are mainly imposed as a retaliation or response to the excessive tariffs being charged by trading partners. Tariffs are used to protect domestic employment and infant industries, protect the consumers, the national security of a country and used for retaliation.
Trade quotas such as imports quotas are Non-tariffs barriers that are used to put a limitation on the number of products that can be imported over a set period. Despite serving the same purpose, a quota is different from the tariff. Tariffs place duty or tax on imports and exports, but quotas aim at providing limitations on specific goods that will be accepted by defining the quantities. Quotas are mainly used to limit the supply of particular products, which increase the prices and give a chance to local business to capitalize on demands that are unmet (Suranovic, 2006). Also, quotas are imposed so as to forestall dumping of products, which happens when the foreign producers export products at a lesser price than the product costs.
Product standards limitations are implemented for some reasons, such as product safety concerns, manufacturing of goods using substandard materials, issues to do with labeling among others (Maur and Shepherd, 2017). Moreover, it does not matter whether these concerns are true or exaggerated, the important thing is that this limitation on imports benefits the country and its people. Some of the benefits are it creates jobs for the local workers, it protects the country from foreign competitors and allows the new industry to build their competitive advantage. Nevertheless, the issue of product standard has brought national trade dispute, and most people think it is a barrier to trade since a country will introduce a service or a product and will justify it as necessary for the consumer.
Another way of protecting trade is through the government subsidies or when the government subsidizes the local industries (The IB Economist, 2017). The subsidies can take two forms which are tax credits and direct payments, and they are mostly given to individuals and groups they are given to lessen a type of burden, and in this case, the burden is competition from the international market. The main purpose of the government subsid...
Request Removal
If you are the original author of this essay and no longer wish to have it published on the customtermpaperwriting.org website, please click below to request its removal:

