
The 1H and 13C NMR spectra of 4-((Dimethylamino)methyl)benzaldehyde were recorded to assess the hydrogen-carbon interactions. The 1H and 13C spectra 4-((Dimethylamino)methyl)benzaldehyde are shown in Figure 1 and Figure 2 respectively. The signal appearing at d = 9.99 ppm in the 1H-NMR spectrum is due to the C=N moiety of the compound. The two doublets present at d = 7.85 ppm and 7.50 ppm are assigned to protons in the aromatic rings. Protons in the methyl groups are confirmed by the intense signal at 2.26ppm. The presence of carbon in the benzaldehyde group in the 13C-NMR spectrum is confirmed by the intense signal at d = 191.97 ppm. The intense peak at d = 45.38 ppm confirms the presence of methyl carbon moiety of 4-((Dimethylamino)methyl)benzaldehyde. The mass of the compound was confirmed by the high-resolution mass spectrum (Figure 3). The mass of the molecular ion of 4-((Dimethylamino)methyl)benzaldehyde was confirmed at 418.28544amu.
Figure 1. 1H NMR 4-((Dimethylamino)methyl)benzaldehyde
Figure 2. 13C NMR of 4-((Dimethylamino)methyl)benzaldehyde
Figure 3. HRMS 4-((Dimethylamino)methyl)benzaldehyde1H and 13C NMR spectroscopy of BODIPY
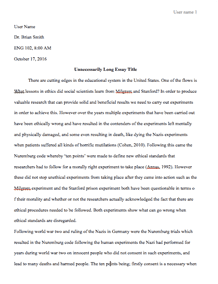
Figure 4 and Figure 5 show the 1H and 13C NMR spectra of BODIPY respectively. In the 1H NMR spectrum, two distinct signals corresponding to the 1,3,5,7-tetramethyls (Figure 4). The intense signal at d = 1.39 ppm confirmed the presence of the 3,5-dimethyls while the signal at d = 2.56 ppm is assigned the 1,7-dimethyls. The tertbutyl groups appear as singlets at d = 2.37 ppm, whereas the methoxy groups could be found at d = 3.67 ppm. The signal peaks between d = 6.40 and d = 7.53 ppm correspond to the phenyl hydrogens. In the 13C-NMR spectrum, the presence of carbon is confirmed by the intense signal at d = 155.49 ppm. Mass spectroscopy confirmed the molecular mass of BODIPY at 383.98604amu (Figure 6).
Figure 4. 1H NMR of BODIPY
Figure 5. 13C NMR of BODIPY
Figure 6. HRMS of BODIPY
BODIPY and its derivatives (2-FormylBodipy, MeI salt of BODIPY, and 1,3-Propanesultone salt of BODIPY) were characterized by 1H-NMR, 13C-NMR, and HRMS. Comparison with 1H-NMR data shows the same profiles of signal peaks for indolylstyryl- and p-methoxyphenylstyryl- aromatic protons, and the peaks for the remaining 1,5,7- and 1,7-methyl groups. Formylation effect of BODIPY is observed as two duplets between d = 11.50 ppm and d = 15.10 ppm (Figure 7). The same effect is seen in Mel salt of BODIPY and 1,3-Propanesultone salt of BODIPY (Figure 9 and Figure 10 respectively). The HRMS spectrum of 2-formylBODIPY shows an increase in molecular mass to 411.22463amu due to an additional oxygen molecule, carbon, and hydrogen (Figure 8). There is also a significant change in molecular weight as Mel salt, and 1,3-Propanesultone salt are formed (Figure 11 and Figure 12 respectively). The 1H-NMR spectra of BODIPY and its compounds shows notable differences (presence of chemical shifts) in the corresponding peaks of the b-hydrogens.
Figure 7. 13C NMR of BODIPY
Figure 8. HRMS of BODIPY
Figure 9. 13C NMR of Mel Salt of BODIPY
Figure 10. 13C NMR of 1,3-Propanesultone salt of BODIPY
Figure 11. HRMS of Mel Salt of BODIPY
Figure 12. HRMS of 1,3-Propanesultone salt of BODIPY
IR Spectroscopy
IR spectra for BODIPY and its derivatives show complex overlapping bands. Figure 13 indicates strong bands between 2500 cm-1 and 3500 cm-1 (attributed to the stretching vibration of C=C-H) as well as a strong band at 1723 cm-1 (carbonyl group). Mel salt of BODIPY (Figure 14) showed strong bands at 1655 cm-1 (stretching vibration C=C groups), 2901 and 2972 cm-1 (alkyl groups stretching). Figure 15 and Figure 16 exhibit similar spectral profiles.
Figure 13. IR Spectrum of BODIPY
Figure 14. IR Spectrum of 2-FormylBODIPY
Figure 15. IR Spectrum of Mel Salt of BODIPY
Figure 16. IR Spectrum of 1,3-Propanesultone salt of BODIPY
Request Removal
If you are the original author of this essay and no longer wish to have it published on the customtermpaperwriting.org website, please click below to request its removal:

